Urban Mass Transit: Transit On-Board Survey
Transit Survey Comparision Detroit, ABQ, Atlanta
We have learned that demographic features in a region could shape transportation features, but how much could these variances in demographic features work? Looking into the transit system’s on-board survey in Detroit, Albuquerque, and Atlanta, there are some interesting findings.
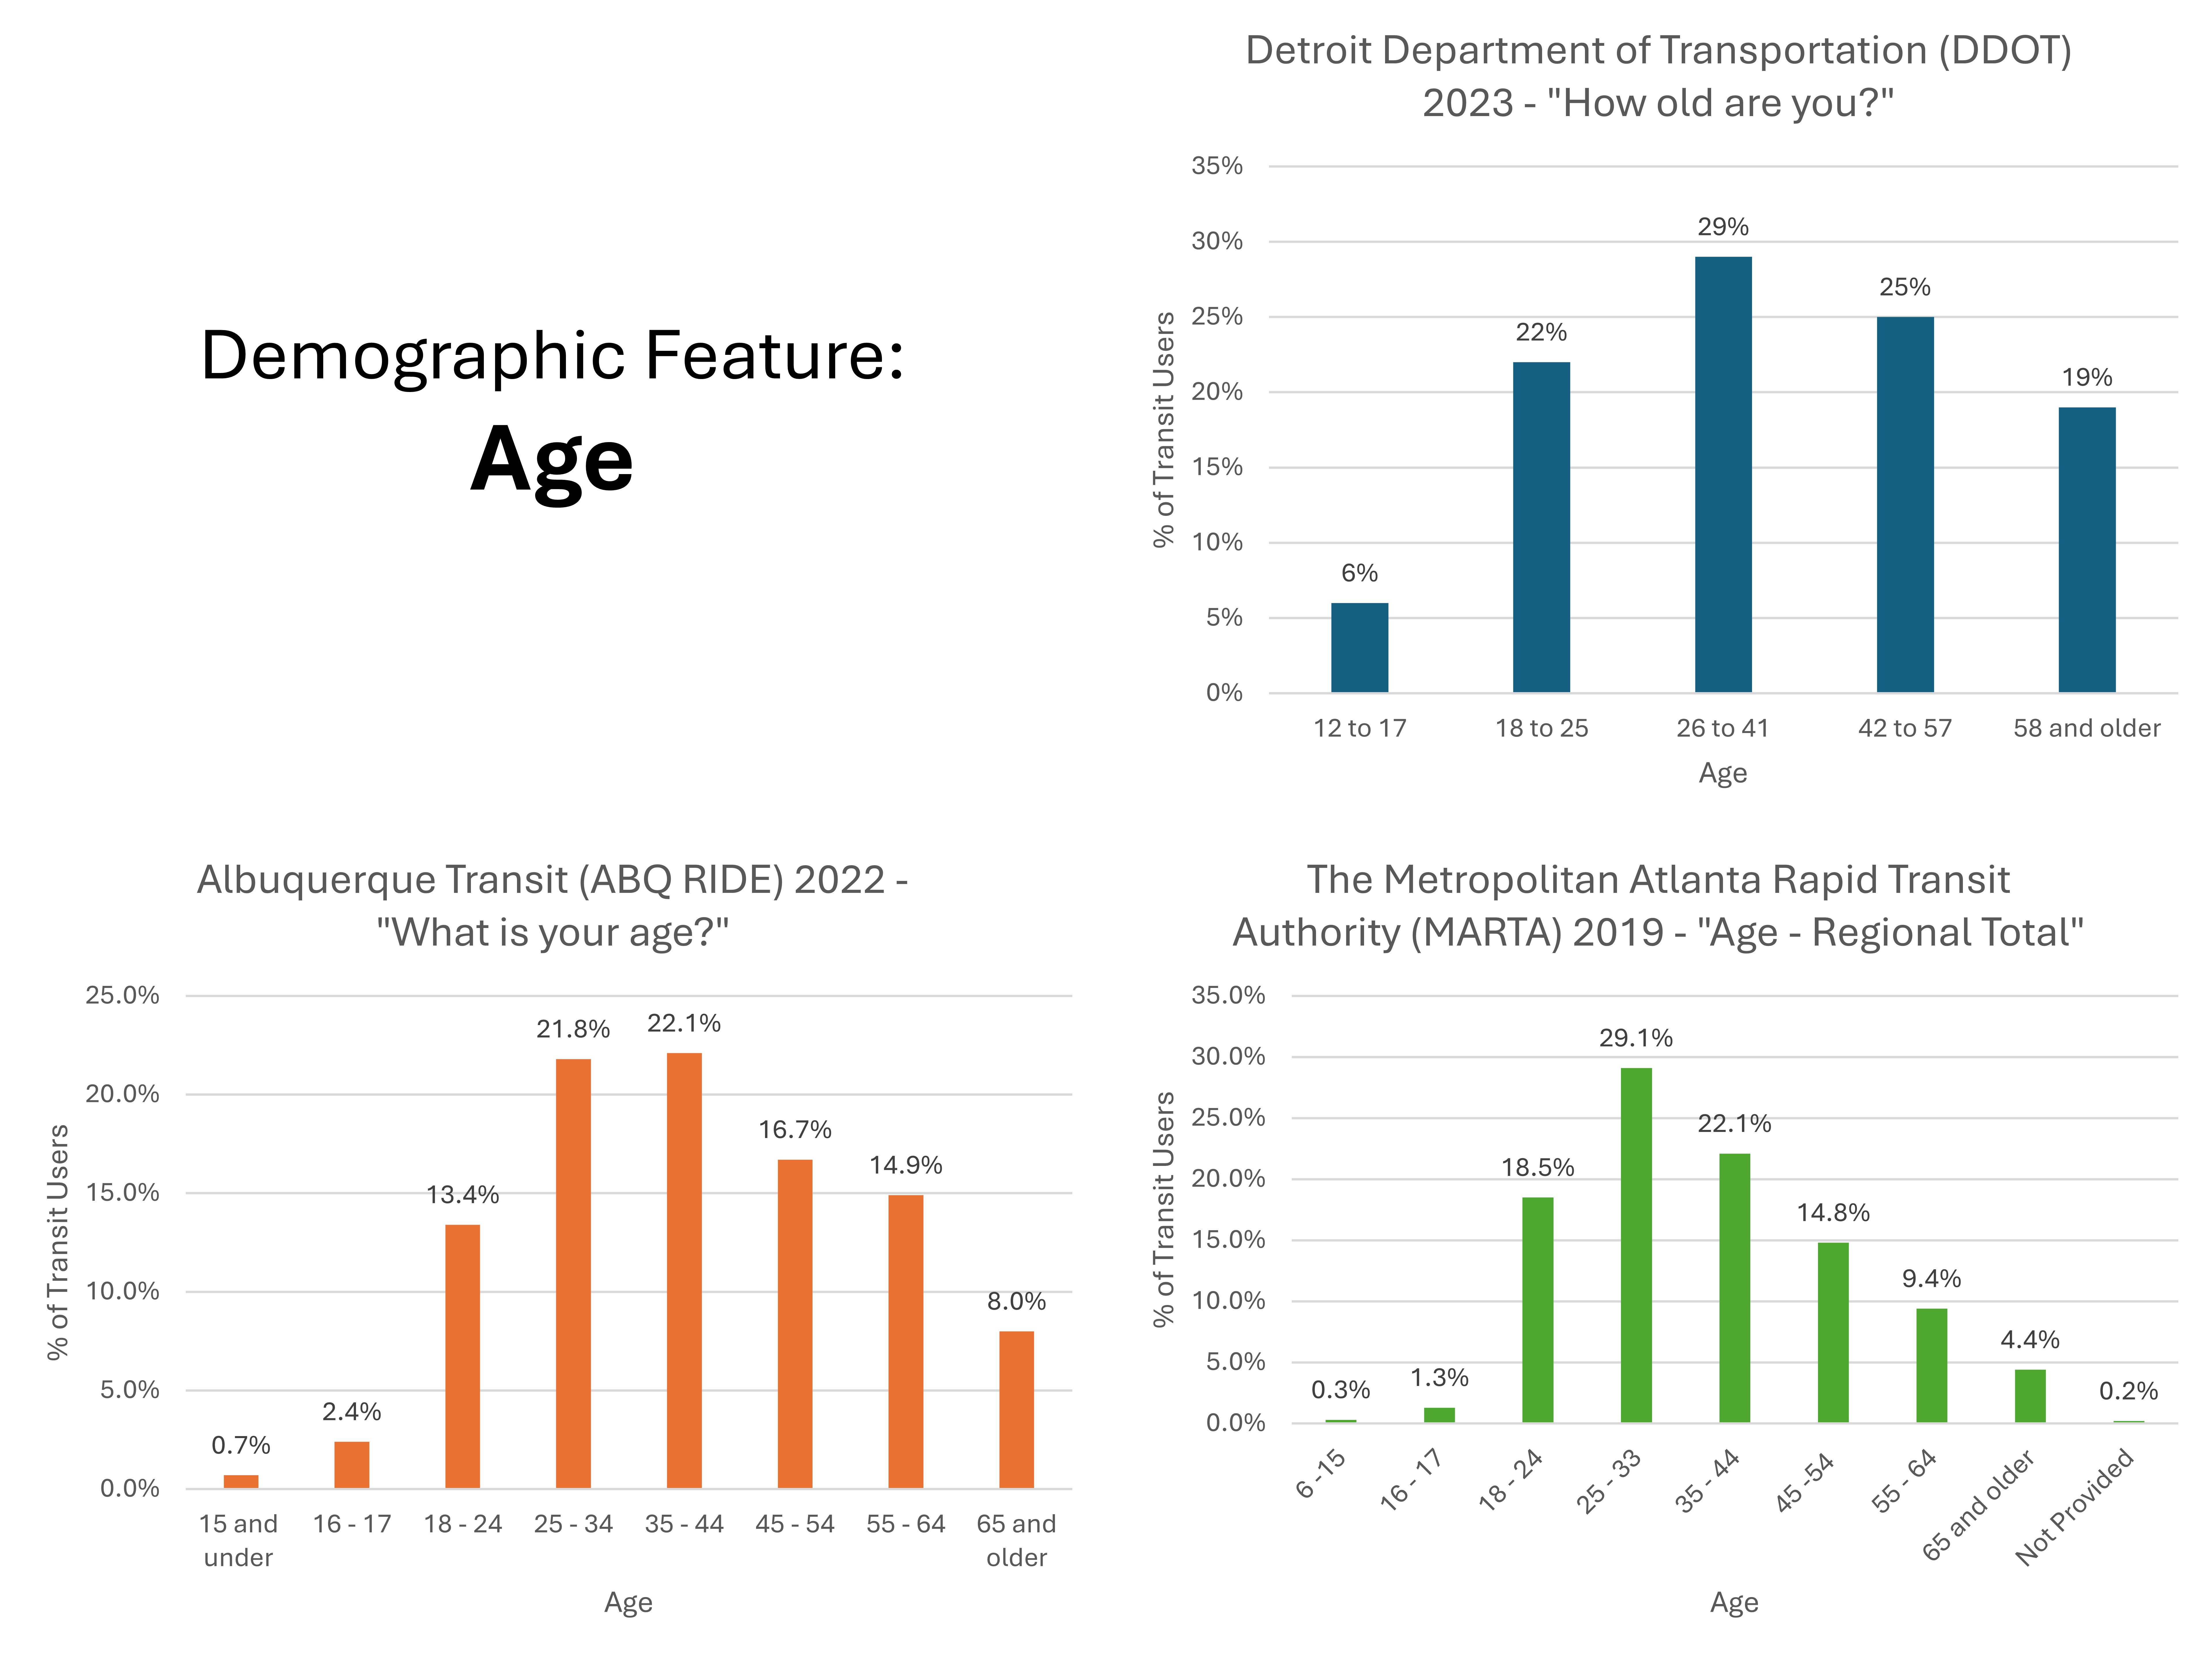
When looking at the age distribution, Atlanta jumped out of the other two cities, where the peak appears earlier than the other two. This is exciting because the system is attracting more younger people, especially young professionals. Albuquerque is another story - a straight split happens between people aged 25-34 and 35-44, and the weight of passengers is heavier in higher ages.
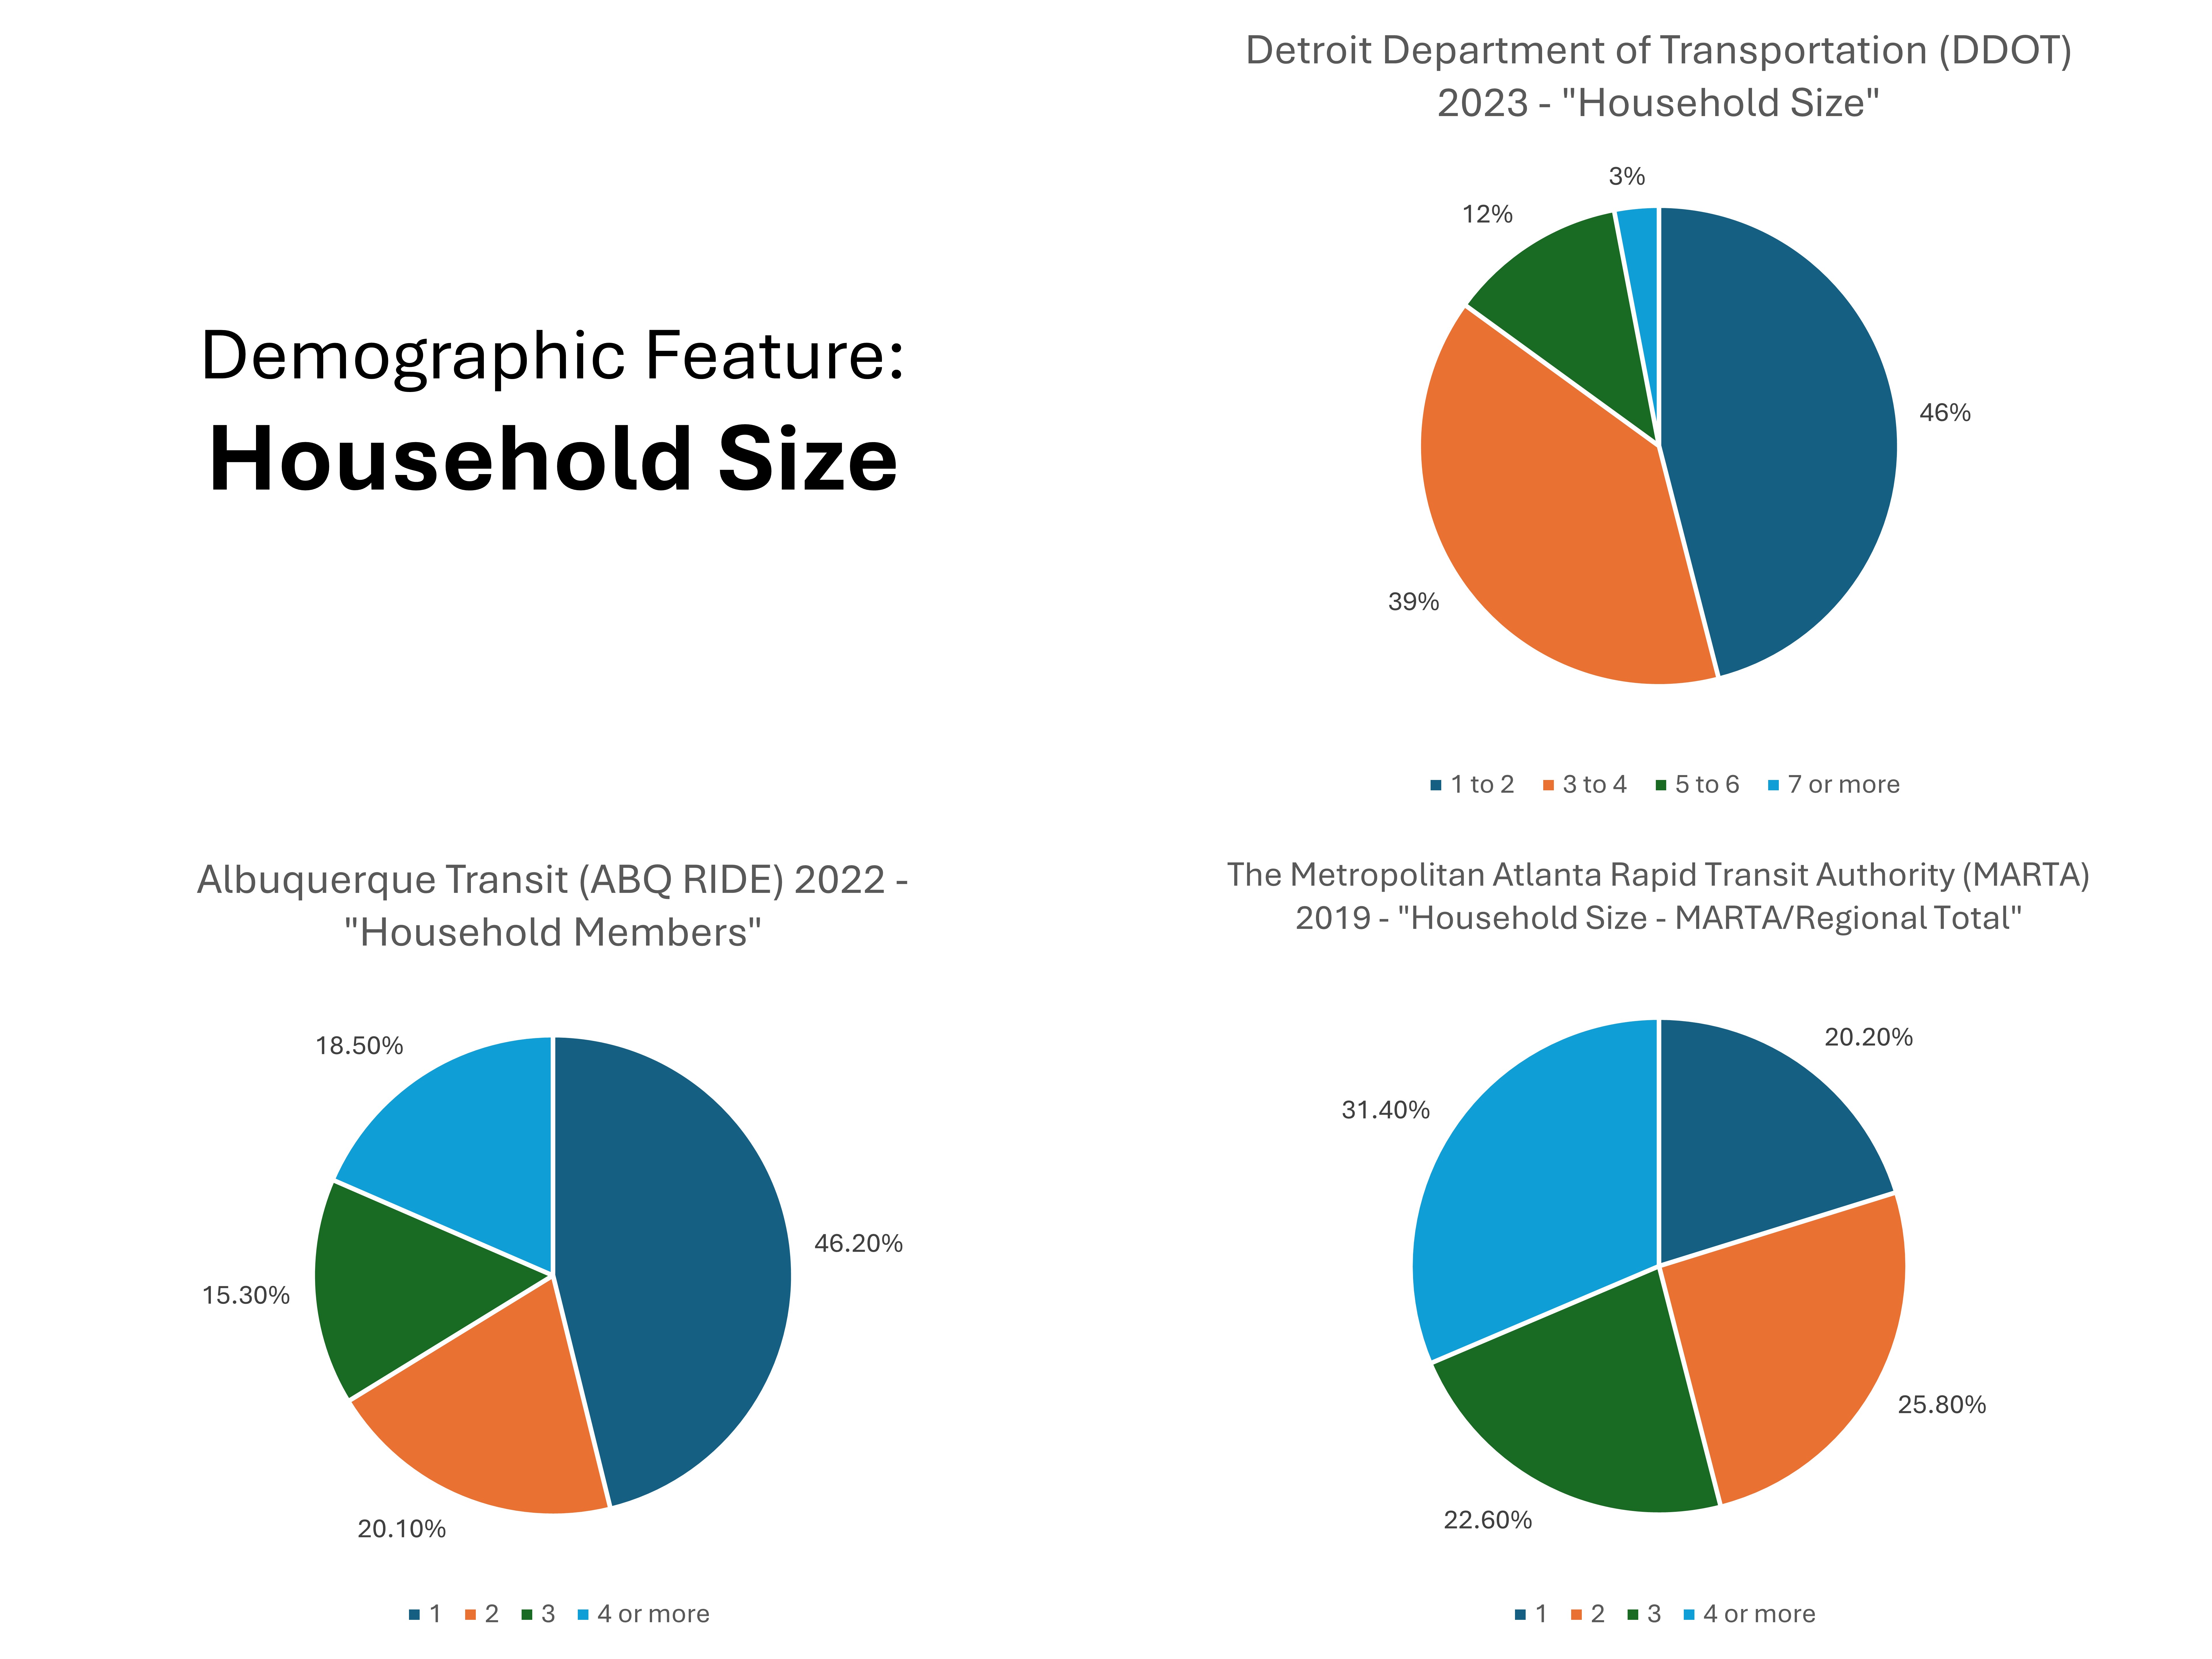
The household size comparison could be very misleading due to the cut point each agency decided. Though we don’t have a detailed breakdown for every single city here, Albuquerque and Atlanta still showed a totally different trend on division. Atlanta has a very well-distributed pattern between different sizes of households, while Albuquerque observed nearly half of the passengers living alone.
We will need to examine Census data to draw more accurate conclusions, but some trends here deserve more attention. Is Albuquerque’s population aging more? What motivates young professionals to use public transportation? These figures provide a starting point for understanding the relationship between demographics and ridership on public transportation.


